Who’s going to win the Maryland Governor’s race today? We know the answer, so read on to find out!
OK, we don’t know the answer, but we are going to take our best shot at predicting the outcome. And we will not do it using party talking points, ideology, impassioned appeals or all that other pap. We will rely on what truly matters on Election Day: mathematics.
Our projections are derived from three sets of estimates:
1. Registration by party
2. Turnout by party
3. Voting intention by party
Of these three, only registration is known. Here is the number of voters by party who are eligible to vote in today’s general election.
Registration alone will not determine the election. Here are the turnout rates by party for the last three gubernatorial general elections, as well as a forecast by Gonzales Research in its latest poll.
Democrats and Republicans turned out at about the same rate in 1998. Since then, Republicans have had a four-point edge. Independents and members of other parties are much less likely to vote. Gonzales estimates that 2010 will be a very different year for turnout and we will discuss that later.
Now here is Bob Ehrlich’s support by party in four different polls.
1. A Survey USA poll taken in November 2002 48 hours before the election. This shows Ehrlich’s support by party in the year that he won.
2. A CNN exit poll taken in November 2006. This shows Ehrlich’s support by party in the year that he lost.
3. The average levels of Ehrlich’s support by party from three October 2010 polls by Gonzales, the Baltimore Sun and the Washington Post.
4. Ehrlich’s support by party from a July 2010 poll by Magellan. This poll, which showed Ehrlich up three points on O’Malley, was Ehrlich’s best poll of the cycle.
Every poll had undecideds except the CNN exit poll. We allocated undecided voters with their party and split independents down the middle so as not to understate Ehrlich’s support.
Taken together, these sets of numbers can be used to construct projections for the race. By plugging in different sets of assumptions about turnout or party voting behavior, we can estimate a range of outcomes for both Ehrlich and O’Malley. We assembled three models.
General Election Model One
In our first model, we assume that turnout will be the same as in 2002 (which was the year Ehrlich won) and that party members will vote in accordance with the average of the three October 2010 polls. The outcome under these assumptions is an 18.4 point blowout for O’Malley.
Now, this is not going to happen. The primary reason is Democratic turnout. The number of registered Democrats eligible to vote in the general election has gone from 1.557 million in 2002 to 1.957 million today. Many of the new Democrats registered during the run-up to President Obama’s election. It is unreasonable to expect all of them to turn out at the same rate as the older, long-term Democrats. Furthermore, Gallup is forecasting heavy turnout nationwide for the GOP. No pollster expects that Republicans will have a four-point turnout edge this year. It’s far too narrow for today’s wave election.
General Election Model Two
In our second model, we are using Gonzales’s turnout forecast – 70% for Republicans, 55% for Democrats and 40% for others – along with the October poll party voting assumptions. Gonzales’s forecast provides for an unprecedented GOP edge in Maryland, but given what happened in the primaries, it is probably justified. Primary election day turnout for Maryland Democrats was 37% in 2002, 33% in 2006 and 25% this year. Primary election day turnout for Maryland Republicans was 30% in 2002, 25% in 2006 and 29% in 2010. That’s a HUGE dropoff for Democrats that has party leaders concerned. The outcome under these assumptions is a 13.2 point win for O’Malley.
O’Malley still wins big because Ehrlich’s support among Democrats is so low. As we showed yesterday, the four most recent polls showed Ehrlich getting just 7-19% of Democrats – far less than the 29% he scored right before the 2002 election. But what if critics of these polls like Blair Lee are right? What if survey problems are underestimating Ehrlich’s appeal to Democrats?
General Election Model Three
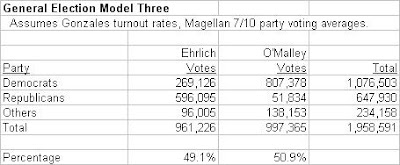
The best poll for Ehrlich in the entire cycle was Magellan’s July 2010 survey, which showed him getting 25% of Democrats and winning by three. Magellan works primarily for Republicans, so their estimates may be the best that Ehrlich will ever get. Also, this poll was taken before most of O’Malley’s attack ads hit. In our third model, we use Gonzales’s turnout forecast and Magellan’s party voting estimates. Under these assumptions, O’Malley wins by 1.8 points.
This illustrates Ehrlich’s fundamental problem: even under the most favorable turnout and party voting assumptions, he loses. He is not matching the appeal he had to Democrats in 2002 and the GOP is not large enough to carry him to victory.
So what will be the margin? Model One is totally unrealistic. Model Two is too lenient to the Democrats. Model Three is too lenient to the Republicans. So let’s split the difference between Models Two and Three.
O’Malley by 7.5.
Tuesday, November 02, 2010
Our Forecast: Ehrlich vs. O’Malley
Posted by
Adam Pagnucco
at
7:00 AM
![]()
![]()
Labels: Adam Pagnucco, Martin O'Malley, polls, Robert Ehrlich


