Like many of you, we are eagerly entering the precinct-level counts from the recent primary. (OK, we know that not all of you are on the edges of your seats about that – just the really nerdy ones. But we love all of you data dorks on MPW!) While we work on that task, we offer our readers a new layer of electoral analysis. In our prior work, especially on the Council At-Large race, we focused on precinct-level geography in assessing the strengths and weaknesses of candidates. Now we are ready to integrate something new: demographics.
As part of the ten-year Census, the U.S. Census Bureau collects data on race and Hispanic status on a variety of geographic levels, including all the way down to election precincts. State and local governments as well as courts are supposed to consider that data as part of redistricting. We have collected and crunched distributions of Hispanic, white non-Hispanic, black non-Hispanic and Asian non-Hispanic and merged it with Democratic primary results at the precinct level for 2006. That allows us to determine turnout and voting patterns for different demographic categories of precincts.
There are some limitations with this technique. First of all, if we can show that eight precincts with a concentration of a particular demographic group voted heavily in favor of Candidate X, we cannot necessarily conclude that that particular group was directly responsible for that outcome. Such an analysis may suggest that, but it does not necessarily prove that. Second, the demographic data is ten years old. We used data for all residents as opposed to voting residents because we believe the teenagers of 2000 may well be the voters of 2010. But that does not truly fix the time lags associated with using ten-year-old data. Our hunch is that non-white population shares have increased all over the county, but we will not be able to see that at the precinct level for 2010 for another couple years. Third, a few of the precinct definitions have changed since 2000. Some have merged and others have split up. We have tried to compensate for that by redistributing demographic results across split districts. So, for example, if Precinct A is 40% white, and is then split up into Precincts B and C, we assume that both B and C are 40% white. That is FAR from perfect, but if A, B and C remain in the same council district, legislative district, zip code and locality, it won’t matter very much. Finally, there are sample errors associated with the Census data. Even with high citizen response rates, the Census Bureau cannot collect demographic data on every single human being in every precinct.
The above caveats shows that our analysis is not perfect, but it’s the best we can do.
Let’s start by acknowledging that the county’s demographic groups are not distributed evenly across its land area. Here is the percentage of residents who were white in 2000 by census tract.
Here is the percentage of residents who were African American in 2000 by census tract.
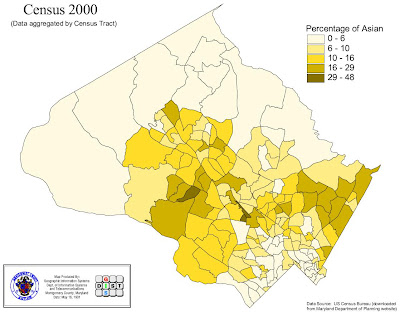
Here is the percentage of residents who were Asian in 2000 by census tract.
And here is the percentage of residents who were Hispanics in 2000 by census tract.
Keep these maps in mind as we start looking at demographics and geography in Part Two.
Monday, September 27, 2010
MoCo Demographics and Voting, Part One
Posted by
Adam Pagnucco
at
7:00 AM
![]()
![]()
Labels: Adam Pagnucco, At-Large Data, Council At-Large, Demographics, Montgomery County


