Here's the order of finish in the Council At-Large general election.
Elrich (D)
Floreen (D)
Leventhal (D)
Riemer (D)
Dyer (R)
Fennel (R)
Rippeon (R)
Uncapher (R)
Gluck (Green)
Which one of these politicians will change his or her surname to "Aaron" first?
Showing posts with label Council At-Large. Show all posts
Showing posts with label Council At-Large. Show all posts
Wednesday, November 03, 2010
Alphabet Soup


Tuesday, October 26, 2010


Monday, October 25, 2010
Duchy Finishes with $146k in the Bank
Council Member Duchy Trachtenberg has reported $145,965.97 in cash on hand in her campaign account as of 10/17/10. No other council-at-large candidate reported having more than $8,000. This means that Trachtenberg left about half of her January warchest unspent during the campaign.
Trachtenberg lost the fourth at-large spot in the primary to George Leventhal by just 3,981 votes. Since countywide mailings to regularly voting Democrats cost about $30,000-40,000 depending on how the targeting is set, Trachtenberg could have afforded another 3-4 mass mailings. Could they have saved her and sent Leventhal home?
We'll never know.


Friday, October 22, 2010
George Leventhal for Council At-Large, 2002
George Leventhal won his first at-large council race in 2002 the same way he won his next two elections: with lots of endorsements, especially from MCEA. He devoted an entire mailer to education that year which we reprint below, but he couldn't help throwing in a quote from his former boss, U.S. Senator Barbara Mikulski.


Thursday, October 21, 2010
Nancy Floreen for Council At-Large, 2002
Nancy Floreen won her first at-large primary in 2002, in which she finished third. Here's a mailer from that year in which she touts endorsements from County Executive Doug Duncan and former County Executive Neal Potter, who at the time represented competing ideologies in county politics. Floreen has won three straight at-large primaries without the Apple Ballot, the only MoCo candidate we know of who has performed that feat.


Wednesday, October 20, 2010


Tuesday, October 19, 2010
Marc Elrich for Council At-Large, 1994
Marc Elrich may have scored a sweeping victory in his at-large reelection run last month, but it was not always this way. Elrich ran four times - in District 5 in 1990 and 1998 and at-large in 1994 and 2002 - before winning an at-large seat in 2006. In every at-large race, he has done better than the last time. Elrich finished seventh in 1994, sixth in 2002, second in 2006 and first this year.
Here's a mailer from Marc Elrich's first at-large campaign in 1994.


Monday, October 18, 2010

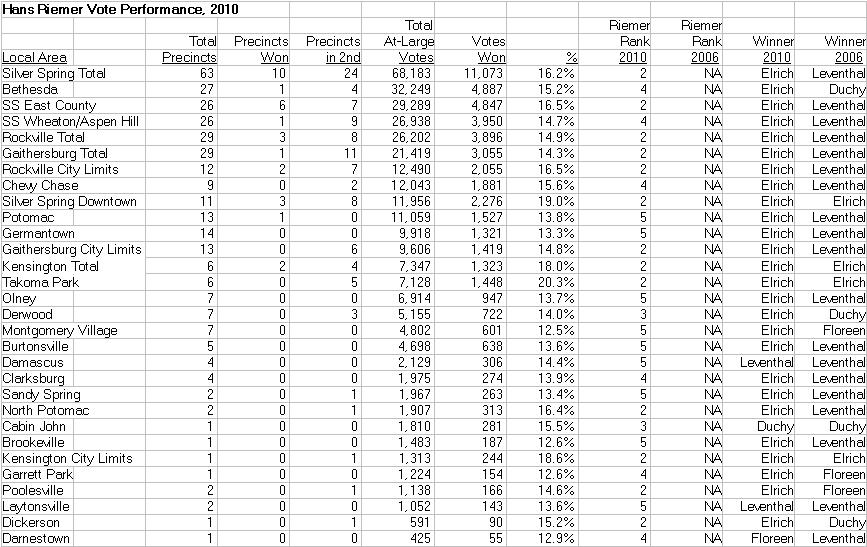
MoCo Primary 2010: Council At-Large Precinct Results
Total Results (Including Absentees and Provisionals)
By District
By Local Area
By Race/Ethnicity
Monday, October 04, 2010
Blair Ewing's Walk Piece, 1998
Blair Ewing served 22 years on the Board of Education before finally running for a County Council at-large seat in 1998. He finished third that year and went on to lead a revolt against County Executive Doug Duncan on living wage, development and the ICC. This is the walk piece he used in winning his first, and only, term on the County Council.

Thursday, September 30, 2010
Phil Andrews, Council At-Large, 1994
Phil Andrews is now known as the virtually invulnerable County Council Member from District 3 (Rockville/Gaithersburg), but he did not start out that way. Andrews first ran for a council at-large seat in 1994. Here is his kickoff letter to Democratic Party activists, citing his experience with Common Cause and his vow not to take PAC or developer money - a promise he has kept to this day. Andrews would not win this particular election, but it set him up nicely to win his district seat four years later.

MoCo Demographics and Voting, Part Four
Five top-tier candidates ran in the 2006 Council At-Large primary: incumbents George Leventhal, Nancy Floreen and Mike Subin and labor-backed challengers Marc Elrich and Duchy Trachtenberg. A host of less competitive candidates also ran, including four who were black and one who was Asian.
Did the demographic characteristics of the county’s precincts have any effect on these candidates’ votes?
Following are the vote totals of the five major at-large candidates by demographic category of precinct.
Overall, the rank order of finish in the 2006 Democratic at-large primary was George Leventhal, Marc Elrich, Duchy Trachtenberg, Nancy Floreen and Mike Subin, in that order. Those ranks did not change very much in different kinds of precincts. Leventhal had a great year and finished first in most places. Marc Elrich was a Takoma Park City Council Member and had run twice before in majority-minority District 5, so he did very well in heavily black precincts in those areas. Duchy Trachtenberg ran well in Bethesda since she had run for council there four years before. Her performance in white precincts was driven by her strength in Bethesda. Mike Subin ran fifth nearly everywhere. In none of these categories did a candidate of color break into the top four, though in precincts where blacks were 33% or more of the population, Hugh Bailey (who is African American) did edge out Subin for fifth.
The bottom line in our analysis is that we do not detect major race- or ethnic-based voting patterns in the 2006 at-large primary. Perhaps that was more of a factor in the 2008 and 2009 Council District 4 special elections, when Nancy Navarro was on the ballot. Perhaps things will work out differently in 2010.
And since we are now putting the finishing touches on the 2010 data, we will find out soon enough.
Wednesday, September 29, 2010
End Gridlock Team, Council At-Large, 2002
During the entire 1998-2002 term, freshman Council Member Blair Ewing battled County Executive Doug Duncan on the ICC, development policy, living wage and other issues. In the spring of 2002, intense speculation centered on whether Ewing would challenge Duncan in the primary. Ewing instead formed a slate of challengers to take over the council, prompting Duncan to form his own slate: the End Gridlock Team. Duncan's team massively outspent Ewing and swept all the at-large seats. End Gridlock did many negative mailers, some of which we will be reprinting, but below is one of the positive ones.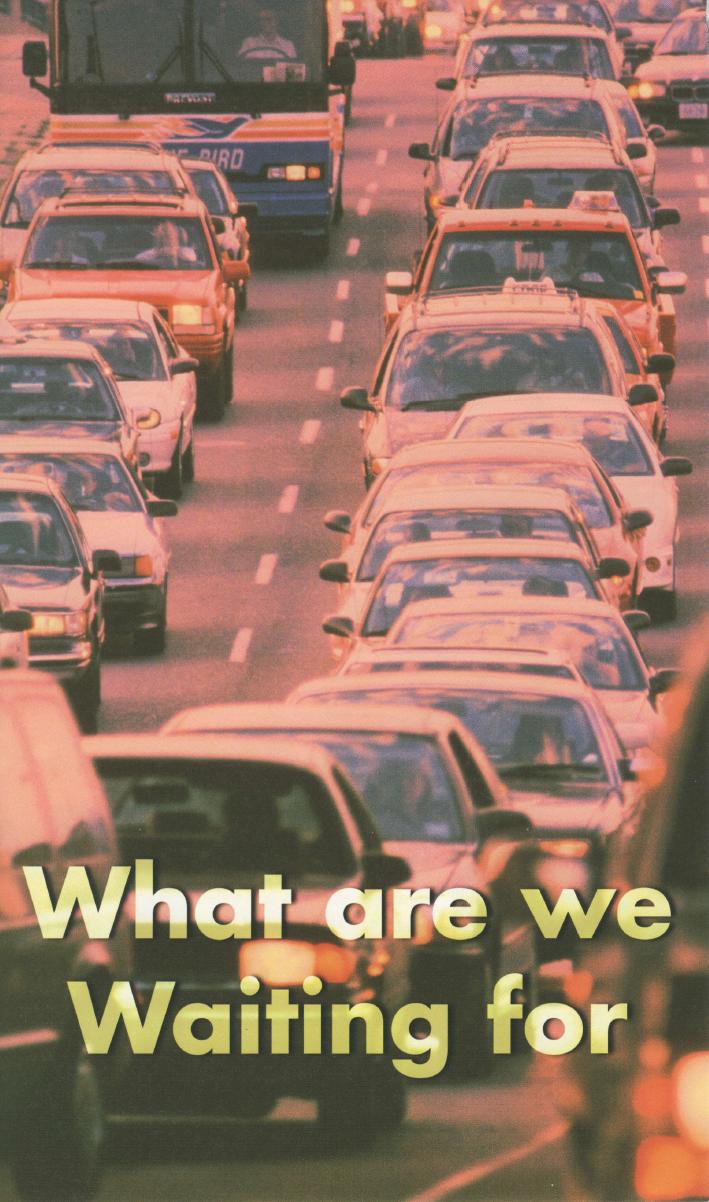


MoCo Demographics and Voting, Part Three
Conventional wisdom holds that voters of color do not turn out at the same rate as white voters. How true is that in Montgomery County?
As we detailed in Part One, we have collected precinct-level data on population percentages of Hispanic, white non-Hispanic, black non-Hispanic and Asian non-Hispanic residents and merged it with precinct-level turnout and voting data. This does not allow us to see the turnout percentages for each group, or the voting behavior of each group. But it does allow us to see whether precincts that are dominated by each group tend to behave differently from other precincts.
Following are the turnout rates by different demographic category of precinct in the 2006 primary. These rates include all voters, not just Democrats.
The countywide turnout rate was 24.0%. In precincts with white population shares of more than 90%, that turnout climbed north of 29%. In precincts with Hispanic and Asian population shares of more than 33%, turnout dipped to below 20%. In precincts with black shares of more than 33%, turnout was 23.1% - not that different from the countywide average. That may be because African Americans are concentrated in District 20, and that district saw a barnburner of a Senate race (Ida Ruben vs. Jamie Raskin) in 2006.
The turnout rates differ by precinct demographic, but not that much. Compare these differences to turnout rates by raw geography.
There is actually more variation on geography than there is on demographics. Several Upcounty areas had turnout rates in the mid-teens, while Takoma Park topped 32%. Now perhaps the Upcounty areas had more Republicans and unaffiliated voters, who have fewer voting options in a primary, and that explains their lag. But at least in the 2006 primary, geography was as good – and maybe even better – a predictor of turnout than race or Hispanic status.
So did demographically diverse precincts vote differently from white precincts? We’ll look at the 2006 at-large primary to answer that question tomorrow.
Tuesday, September 28, 2010
MoCo Demographics and Voting, Part Two
As we saw in Part One, MoCo’s major demographic groups are not distributed evenly across the county. Here are the percentages of Hispanics, white non-Hispanics, black non-Hispanics and Asian non-Hispanics in every Congressional, legislative and council district as well as each locality in the county.
Two years ago, we demonstrated that Montgomery County was the most diverse jurisdiction in Maryland. But the county is essentially a group of smaller subdivisions, some integrated and some not. State Legislative District 20, Council District 5 and Takoma Park, East County, Downtown Silver Spring, Wheaton, Burtonsville and the City of Gaithersburg were all “majority-minority” areas in 2000. It’s reasonable to assume that since then, State Legislative Districts 17, 19, 39 and perhaps 18, Council Districts 3 and 4 and North Potomac and Germantown may have also become majority-minority. On the other hand, State Legislative District 16, Council District 1, and Bethesda, Chevy Chase, the Town of Kensington, Damascus and several other rural Upcounty areas are very heavily white.
So does any of this affect actual voting behavior? We’ll start investigating that in Part Three.
Monday, September 27, 2010
MoCo Demographics and Voting, Part One
Like many of you, we are eagerly entering the precinct-level counts from the recent primary. (OK, we know that not all of you are on the edges of your seats about that – just the really nerdy ones. But we love all of you data dorks on MPW!) While we work on that task, we offer our readers a new layer of electoral analysis. In our prior work, especially on the Council At-Large race, we focused on precinct-level geography in assessing the strengths and weaknesses of candidates. Now we are ready to integrate something new: demographics.
As part of the ten-year Census, the U.S. Census Bureau collects data on race and Hispanic status on a variety of geographic levels, including all the way down to election precincts. State and local governments as well as courts are supposed to consider that data as part of redistricting. We have collected and crunched distributions of Hispanic, white non-Hispanic, black non-Hispanic and Asian non-Hispanic and merged it with Democratic primary results at the precinct level for 2006. That allows us to determine turnout and voting patterns for different demographic categories of precincts.
There are some limitations with this technique. First of all, if we can show that eight precincts with a concentration of a particular demographic group voted heavily in favor of Candidate X, we cannot necessarily conclude that that particular group was directly responsible for that outcome. Such an analysis may suggest that, but it does not necessarily prove that. Second, the demographic data is ten years old. We used data for all residents as opposed to voting residents because we believe the teenagers of 2000 may well be the voters of 2010. But that does not truly fix the time lags associated with using ten-year-old data. Our hunch is that non-white population shares have increased all over the county, but we will not be able to see that at the precinct level for 2010 for another couple years. Third, a few of the precinct definitions have changed since 2000. Some have merged and others have split up. We have tried to compensate for that by redistributing demographic results across split districts. So, for example, if Precinct A is 40% white, and is then split up into Precincts B and C, we assume that both B and C are 40% white. That is FAR from perfect, but if A, B and C remain in the same council district, legislative district, zip code and locality, it won’t matter very much. Finally, there are sample errors associated with the Census data. Even with high citizen response rates, the Census Bureau cannot collect demographic data on every single human being in every precinct.
The above caveats shows that our analysis is not perfect, but it’s the best we can do.
Let’s start by acknowledging that the county’s demographic groups are not distributed evenly across its land area. Here is the percentage of residents who were white in 2000 by census tract.
Here is the percentage of residents who were African American in 2000 by census tract.
Here is the percentage of residents who were Asian in 2000 by census tract.
And here is the percentage of residents who were Hispanics in 2000 by census tract.
Keep these maps in mind as we start looking at demographics and geography in Part Two.
Subscribe to:
Posts (Atom)


