Saturday, May 31, 2008

What Might Have Been...

When Senator Patrick J. Hogan (D-39) of Montgomery County stepped down last year, he changed history. We are only now beginning to realize the magnitude of that decision.

Senator Hogan was Vice-Chairman of the Budget and Taxation Committee. Senator Ulysses Currie (D-25) of Prince George's County was the Chairman, so Hogan was next in line. When Hogan retired, a prominent Rockville politician told me, "It's devastating to lose P.J. We are going to get screwed." Shortly afterwards, the Special Session passed an income tax hike that relied disproportionately on revenue from Montgomery County because of its progressive nature. An even greater targeting of Montgomery County taxpayers was the reason much of the county's state delegation fought bitterly, and ultimately unsuccessfully, against the millionaire tax.

Hogan's departure resulted in the promotion of Senator Edward Kasemeyer (D-12) to the Vice Chairman position. Longtime Montgomery County Delegate Marilyn Goldwater (D-16) left around the same time, prompting this observation from the Gazette:

The leadership changes leave Montgomery, the state’s largest jurisdiction, with a single committee chairman in each chamber and House Majority Leader Kumar P. Barve (D-Dist. 17) of Rockville. Baltimore city boasts three chairmen, three vice chairmen and the majority whips in each chamber; Prince George’s County has three chairmen and one vice chairman in the General Assembly.
Montgomery County's committee chairs include the Senate Judicial Proceedings Committee (held by District 16 Senator Brian Frosh) and the House Ways and Means Committee (held by District 20 Delegate Sheila Hixson).

Senator Currie appears to be in some trouble. If he falls, Kasemeyer, who represents Baltimore and Howard Counties, will be in line to become the next Senate Budget and Taxation Committee Chairman. That is good news for a Governor who is targeting swing areas in Baltimore County for his re-election. But it is bad news for Montgomery County. With a Chairman Hogan, Montgomery would have been better able to resist humiliations like this. Instead, the county's politicians will be left to ponder what might have been.

Friday, May 30, 2008

A Better Way to Measure Traffic, Part Three

In Part Two, we listed four corridors with high volumes and low speeds. Today, we list four corridors with modest volumes and low speeds. While these corridors perform differently than the ones we listed yesterday, they may be even more clogged. Several of these roadways contain chains of gridlocked intersections that collectively cut down on auto movement.

The Worst Modest Volume, Low Speed Corridors

These corridors have very low speeds but do not have critical lane volumes that exceed policy area standards (at least not in the evening). The relatively modest volumes combined with the crawling speeds suggest that cars have an extremely difficult time squeezing through these gridlocked areas.

Colesville Road, 16th Street to Spring Street

Test Run #1
5/23/07 at 5:06 PM, Eastbound
0.77 Miles in 7.87 Minutes, 5.9 MPH

Test Run #2
5/23/07 at 7:34 PM, Eastbound
0.66 Miles in 5.57 Minutes, 7.1 MPH

PM Critical Lane Volumes
Colesville at East-West Highway: 1061 (Recorded on 6/2/04)
Colesville at Georgia: 1049 (Recorded on 9/26/06)
Colesville at Spring: 1248 (Recorded on 9/20/06)

Notes: This corridor is located in Downtown Silver Spring and runs past the Metro Station.

Frederick Road, Chestnut Street to Montgomery Village Avenue

Test Run #1
5/15/07 at 5:47 PM, Northbound
0.54 Miles in 4.97 Minutes, 6.5 MPH

Test Run #2
5/15/07 at 6:15 PM, Northbound
0.67 Miles in 5.85 Minutes, 7.1 MPH

PM Critical Lane Volumes
Frederick at Chestnut: 1204 (Recorded on 9/30/04)
Frederick at Odenhal: 1372 (Recorded on 11/10/04)
Frederick at Perry: 974 (Recorded on 3/10/04)
Frederick at Montgomery Village: 1427 (Recorded on 5/2/05)
Policy Area CLV Standard: 1450

Notes: This corridor runs near Lake Forest Mall and the I-270/Quince Orchard Road interchange.

Georgia Avenue, Prince Phillip Drive to Olney-Sandy Spring Road

Test Run
5/30/07 at 5:32 PM, Northbound
0.97 Miles in 5.17 Minutes, 11.3 MPH

PM Critical Lane Volumes
Georgia at Prince Phillip: 1145 (Recorded on 3/6/07)
Georgia at King William: 1095 (Recorded on 12/9/03)
Georgia at Olney-Sandy Spring: 1251 (Recorded on 3/15/07)
Policy Area CLV Standard: 1450

Notes: This corridor is just south of the Olney commercial district.

Georgia Avenue, Spring Street to Dennis Avenue

Test Run #1
6/4/07 at 5:15 PM, Northbound
0.46 Miles in 8.32 Minutes, 3.3 MPH

Test Run #2
6/4/07 at 5:15 PM, Northbound
1.46 Miles in 6.67 Minutes, 13.1 MPH

PM Critical Lane Volumes
Georgia at Spring: 1080 (Recorded on 11/17/05)
Georgia at Seminary: 1374 (Recorded on 4/7/05)
Georgia at Beltway: 1206 (Recorded on 11/20/03)
Georgia at Forest Glen: 1377 (Recorded on 6/6/07)
Georgia at Dennis: 1437 (Recorded on 6/7/07)
Policy Area CLV Standard: 1600

Notes: This corridor includes Montgomery Hills, the Beltway/Georgia Avenue interchange and the Intersection of Death. The Planning Department’s staff witnesses this congestion every day because their headquarters is at the southern tip of the corridor. A redesign of Georgia Avenue between 16th Street and Forest Glen Road is the top county priority for state projects requiring planning. The state announced it would undertake planning for this corridor back in January.

These four corridors, as well as the four listed yesterday, present the most urgent and intractable traffic problems in Montgomery County. The Planning Department should be able to dig into these corridors in great detail if they adopt the measurement system that I recommended in Part One. Some of the questions that need to be answered are:

1. Is some level of congestion actually desirable? Heavily populated down-county areas like Bethesda and Silver Spring have large numbers of pedestrians. Policies that speed cars may cause increases in pedestrian accidents.

2. Are there any transit improvements that could ease the congestion? Five of the eight corridors (Wisconsin, Rockville Pike, Colesville, and two on Georgia) are already near Metro stations. Could some of the traffic be headed to areas beyond Metro’s reach? If it is, Metro extensions (including bus rapid transit) may be warranted. US-29 would be a particularly good candidate.

3. What does this information mean for the Purple Line? Four of the eight corridors (Wisconsin, Connecticut, Colesville and Georgia) would be along or close to the route for the Purple Line. But the congestion measurements we have now apply to north-south traffic during evening rush. Would the Purple Line really be effective in alleviating north-south traffic? Perhaps a GPS test drive should be held on East-West Highway, which is the major auto connection between Bethesda and Silver Spring. If its congestion level matches that found in these eight bad corridors, that would strengthen the case for a direct transit connection.

Dear readers, never in the history of Maryland blogdom (or as far as I know, the mainstream media) has anyone suggested such a radical redesign of our traffic measurement system as I have. The Planning Department’s over-reliance on critical lane volumes without context has produced an incoherent, unreliable measurement system that is plagued with bad data. If we cannot correctly diagnose our problems, we will never arrive at a solution. Our current economic downturn will not last forever. When it ends, development will resume and traffic will get even worse. High gas prices will increase our cost of sitting in congestion. The time to re-evaluate, improve and plan for the inevitable is now.

Thursday, May 29, 2008

FBI Raids Home of Senator Ulysses Currie

The Post has details on the raid here. While we do not yet know the reasons for the raid, or even if Senator Currie is the target of of an investigation, this event is hugely significant. As Chairman of the Senate's Budget and Taxation Committee, Currie is one of the most powerful politicians in Annapolis. He has also been a rumored potential successor to Senate President Mike Miller. If Currie falls, many chairs will be rearranged in the State House.

A Better Way to Measure Traffic, Part Two

In Part One, we discussed how GPS-based traffic measurement could work on a county-wide basis. The Planning Department has already done test drives on several corridors, plotting out distances, times and speeds in evening rush hour. When combined with critical lane volume (CLV) measurements, we can get a sense of which corridors are really the worst rush hour drives in Montgomery County.

In general, there are two types of problematic corridors. First, there are stretches of major roads characterized by high volumes and low speeds. Second, there are stretches characterized by modest volumes and low speeds. The modest-volume corridors are no less troubled than the high-volume corridors. In fact, some corridors may record lower volumes because chains of clogged intersections prevent large numbers of cars from getting through.

Using Planning’s preliminary data, we have identified four high-volume and four modest-volume corridors that all recorded low travel speeds. These are the true problem areas in Montgomery County, not the “most-congested intersection” list that is based on flawed, one-day CLV estimates.

Today, we report the worst high-volume corridors and tomorrow we report the worse modest-volume corridors. Unlike the Planning staff, we do not rank them; I am sure Wisconsin Avenue drivers are just as miserable as Georgia Avenue drivers like myself. For each corridor, we report the date, time and results for the test drives as well as any CLV measurements taken in its component intersections. We also report the policy area standard CLV. Any intersections with CLVs measured above their policy area standard are rated as “failing” by the Planning Department.

The Worst High Volume, Low Speed Corridors

The following four corridors are characterized by high auto volume (often exceeding allowable policy area standards) and low speeds. Lots of cars can and do get through these areas, but the experience is agonizing.

Connecticut Avenue, Bradley Lane to the Beltway

Test Run
6/4/07 at 6:20 PM, Northbound
2.01 Miles in 19.6 Minutes, 6.1 MPH

PM Critical Lane Volumes
Connecticut at Bradley: 1577 (Recorded on 3/17/04)
Connecticut at East-West Highway: 1829 (Recorded on 3/29/06), Exceeds Standard
Connecticut at Jones Bridge: 2017 (Recorded on 6/6/07), Exceeds Standard
Connecticut at Beltway: 1245 North, 1100 South (Recorded on 3/9-3/10/04)
Policy Area CLV Standard: 1600

Notes: This is the major commuter route between Chevy Chase, Kensington and Downtown D.C.

Georgia Avenue, Arcola Avenue to Randolph Road

Test Run
6/4/07 at 5:15 PM, Northbound
0.69 Miles in 8.03 Minutes, 5.2 MPH

PM Critical Lane Volumes
Georgia at Arcola: 1471 (Recorded on 2/23/06)
Georgia at Randolph: 1910 (Recorded on 2/23/06), Exceeds Standard
Policy Area CLV Standard: 1600

Notes: Georgia at Randolph had the second-highest AM CLV in the county. A grade-separated interchange at this intersection is the county’s top priority among state construction projects. The state announced it would fund the project in January 2008. The Glenmont Metro Station is just to the north.

Rockville Pike, Congressional Lane to Edmonston Drive

Test Run #1
6/7/07 at 5:42 PM, Northbound
0.69 Miles in 4.62 Minutes, 9.0 MPH

Test Run #2
6/7/07 at 6:02 PM, Northbound
0.46 Miles in 2.93 Minutes, 9.4 MPH

PM Critical Lane Volumes
Rockville Pike at Congressional: 1538 (Recorded on 6/3/04), Exceeds Standard
Rockville Pike at Edmonston: 1590 (Recorded on 10/13/04), Exceeds Standard
Policy Area CLV Standard: 1500

Notes: This corridor is just north of the Twinbrook Metro Station and is adjacent to the Woodmont Country Club.

Wisconsin Avenue, Battery Lane to Cedar Lane

Test Run
5/12/05 at 4:52 PM, Northbound
1.24 Miles in 11.0 Minutes, 6.8 MPH

PM Critical Lane Volumes
Wisconsin at Battery: 1745 (Recorded on 2/8/07)
Wisconsin at Jones Bridge: 1536 (Recorded on 12/22/05)
Wisconsin at Cedar: 1996 (Recorded on 9/7/06), Exceeds Standard
Policy Area CLV Standard: 1600 (1800 at Battery)

Notes: This corridor extends from the northern edge of Downtown Bethesda through the National Naval Medical Center and is just south of the Beltway interchange. The extremely-congested, high-volume traffic provides a strong justification for BRAC-related transportation work.

Tomorrow, we will look at corridors with modest Critical Lane Volumes and slow speeds.

On Political Pulse

Maryland State Delegates Brian Feldman (from District 15, which is the Potomac Gaithersburg area) and Tom Hucker (from District 20, which is the Silver Spring, Takoma Park area) will be on the 'Political Pulse' TV Show on:

Thursday, May 29th at 9:00 p.m.; and

Tuesday, June 3rd at 9:30 p.m.

Issues that will be discussed include:

1. How the substantial raises given by Montgomery County to its employees are viewed by State Legislative leaders in Annapolis and what impact the raises might have during the process wherein it is determined how much in state funds is paid to Montgomery County and other Maryland counties;

2. The effect of the recently-passed 'millionaires tax' on Montgomery County residents;

3. Whether slots would be a less burdensome way to raise revenues from the perspective of Montgomery County residents (as compared to additional taxes); and

4. The Purple Line and the Corridor Cities Transit-way (proposed mass transit projects in Montgomery County) and whether there are enough funds to build either or both of the projects.

Political Pulse is on Channel 16 in Montgomery County.

Wednesday, May 28, 2008

A Better Way to Measure Traffic, Part One

In our previous two posts, we outlined the county’s reliance on Critical Lane Volume (CLV) to measure traffic and identify problem intersections. We identified two problems with this system. First, the county’s measurement of CLV at each intersection only once every four years or so guaranteed the proliferation of fluky measurements. Second, CLV has different meanings under different circumstances. A low CLV could mean few cars or it could mean that few cars are able to move through an intersection due to excessive congestion.

There is a better way to measure traffic than this.

Any longitudinal data system must accomplish three things. First, the users must have reality-based data that actually measure what the users intend to measure. Second, there must be large numbers of observations to build an adequate sample size. Third, identical procedures must be applied over and over again in different conditions to isolate out their effects. The Planning Department’s current traffic measurement system has none of these characteristics.

But there is hope for something better that is buried deep within the planners’ own documents. In the appendix to the 2008 Highway Mobility Report, the staff has added something new: actual test runs by cars equipped with GPS devices on major corridors in rush hour. On pages 69-82, the staff shows the results of rush hour test drives on Wisconsin Avenue, Rockville Pike, Frederick Road, Georgia Avenue, Norbeck Road, Colesville Road, Columbia Pike, Connecticut Avenue, Clopper Road and Great Seneca Highway. Yes, these drives were only taken on one day each in May 2005, May 2007 or June 2007. But the results are very informative – you can actually see which intersections cause low speeds, and which stretches of these corridors have free flow.

Here is the kind of simulation that reflects reality. People do not drive through problem intersections once every four years, as the CLVs measure. They drive through long, clogged corridors every day, often during rush hour. The challenge is how to collect more of this data so it is not subject to outlier results determined by bad weather, accidents or other unusual conditions.

The solution is to draw on the hundreds of thousands of real live drivers who navigate this county every day. The Planning Department should offer county residents temporary GPS units for their cars in return for a payment of $100 per month. (That is the equivalent of one to two weeks of free gas!) These units would record all driving information and store them in internal memory for download upon return to the staff. Planning could rotate the units among different residents, perhaps 50-100 different people every month. After one year, Planning would have an unrivaled database of tens of thousands of actual drives under every condition imaginable. Planning would be able to judge the performance of any major roadway in the county under any weather condition, on any day, at any time of the day or night. Additionally, matching this traffic data with the police department’s online traffic accident database would enable planners to see the impact of auto collisions on roadway performance for every major route in the county.

How much would all of this cost? GPS units rent for as little as $5 per day and Planning could negotiate a better deal for lots of them. If Planning allocated them to 50 different residents each month and paid them $100 per month, the total rental and payment cost would be $151,250 per year. If Planning allocated them to 100 residents, the cost would be $302,500. Add on the cost of one full-time employee to monitor the program and the cost would be roughly $300,000 to $450,000 per year. The Planning Department’s total budget is approximately $19 million and it is currently suffering from cuts.

But Planning does not necessarily have to request lots of extra money. Why not pay for this, at least in part, by cutting back on CLV measurement? As we have seen, critical lane volume estimates taken in isolation do not by themselves provide reliable measurements of traffic. Do we really need 422 fluky, seldom-updated CLVs, many of which are taken at tertiary intersections with low volume? Why not reduce the number of intersections measured by CLVs and use the money for reality-based GPS measures instead?

Until the Planning Department moves to this sort of system, its existing test drive data provides a tantalizing peek at how a real traffic measurement system could work. In Part Two, we will begin looking at some of the new data Planning has already gathered.

Tuesday, May 27, 2008

Council Is Back To Full Strength


Clerk of Court, Loretta Knight, swears in Don Praisner with
County Executive Ike Leggett looking on.


Didn't beat WaPo on the news on Don Praisner's swearing-in. But we do have pictures, something they do not have.


Councilmember Don Praisner complete the process
with his signature in the official register.


Besides the normal list of Praisner supporters and his family, several other elected officials were in attendance: Council President Mike Knapp; Council Vice President Phil Andrews; Councilman George Leventhal; and former Delegate Adrienne Mandel.

Why the Delay?
The reason for not immediately swearing in Don Praisner after he defeated Mark Fennel in the general election on May 13 was the Board of Elections (BOE) had to certify the elections and they could not do that until the final absentees (those from overseas) were counted on Friday.

The final official tally was Praisner 6,123 (66.2%), Fennell 3,092 (33.4%) with 32 (0.3%) Write-Ins. The 9,247 votes were less than the combined votes in the two party primaries of 9,577 (GOP 1,919 and Dems 7,658).


While the BOE does not list precinct results by party the mid day counts by the MCDCC had under 7% of the voters being Non-affiliated (NA) with either party. NAs are around 20% of the district. Which would explain the turnout not being higher than the primary on April 15. For a detailed analysis of the Democratic primary look at Adam's post.

Only twenty-one days until our next special election, to replace Congressman Al Wynn with either Democratic nominee Donna Edwards or Republican nominee Peter James. Even for a political junkie, I look forward to have nothing to not having a campaign on the horizon. Hurry up June 18!!!

Defining Deviancy Down at the Intersection of Death, Part Two

In Part One, we described how Montgomery County’s Planning Department relies on Critical Lane Volume (CLV) to estimate congestion at intersections across the county. Any statistical system that relies on just one measure, taken very infrequently, with little collaborating information is prone to fluky data. And that has happened at the Georgia Avenue-Forest Glen Road intersection, lovingly referred to by its neighbors as the Intersection of Death.

According to the Planning Department, this intersection went from being the most congested in the county to falling below the county’s allowable congestion standard for its policy area. Why? Because its morning CLV declined by 26% between surveys taken on 8/28/03 and 6/6/07. They would like us to believe that one-quarter of our traffic congestion has magically disappeared even though there have been no major engineering changes at the intersection. Similarly, only four of the ten most-congested intersections reported in 2006 have returned to the current 2008 list. Have the six intersections that fell off the list been “fixed,” surpassed by others that have become worse or simply fallen victim to bad CLV measurements?

While the Gazette covered our objections to traffic measurement at Georgia and Forest Glen, they spent a bit more time discussing the intersection’s infamous nickname than exploring the underlying data issues. I presented the following case study of the intersection to the Planning Board two weeks ago. Just looking at this one intersection calls into question the statistical validity of how traffic is measured in this county.

*****

Testimony of Adam Pagnucco
Montgomery County Planning Board, 5/15/08
Item 8: Highway Mobility Report 2008

Good morning. My name is Adam Pagnucco. I am Chairman of the Forest Estates Community Association's Crossing Georgia Committee as well as my civic association's incoming county government liaison. Today I offer my observations on the planning staff's new Critical Lane Volume (CLV) estimates for the Georgia Avenue-Forest Glen Road intersection.

In the 2006 Highway Mobility Report, the Georgia-Forest Glen intersection was ranked as the most congested in the county with an AM CLV of 2106 and a PM CLV of 1643. Those counts were taken on 8/28/03. No one in the surrounding area was surprised. What was surprising were the new CLV counts taken on 6/6/07: an AM CLV of 1553 and a PM CLV of 1377. If those counts are to be believed, then congestion has decreased at this intersection by 26% in the morning and 16% in the evening in just four years.

Now let's remember the location of Georgia at Forest Glen. It is adjacent to the Forest Glen Metro station, one block away from the Beltway interchange and three blocks away from Holy Cross Hospital, the second-biggest hospital in the state. Any car coming from the north to the Beltway must pass through it. Most vehicles heading to Holy Cross, and all of them coming from the Beltway, must pass through it. And hundreds of pedestrians cross the street every day to use Metro. No other intersection in the county, and possibly the state, has this combination of characteristics.

The principal change in recent traffic conditions around the intersection was the 2005 expansion of Holy Cross Hospital. That expansion, the biggest in the hospital's history, added 210,000 square feet of new space to the facility. The hospital reports that it had 128,591 visitors in 2003 and 157,573 visitors in 2007, a 23% increase after the expansion was finished. But now the hospital claims that it is bursting at the seams and it intends to expand again. Its plan calls for a new parking garage that would hold 500-700 more cars, which the hospital says it needs because cars are stacking up in its existing garage. Given the phenomenal increases in patient visits and the hospital's need for another expansion so soon after its last one, how can anyone believe that traffic congestion at Georgia and Forest Glen has really declined by double digits in just four years?

But there is more. In 1995, the planning staff estimated CLV at Georgia and Forest Glen at 1511 in the morning and 1530 in the afternoon. If the 2007 CLV is to be believed, then current traffic congestion is only 3% worse in the morning and is actually 10% less in the evening than it was in 1995. That's right, we are told that evening rush has actually improved by 10% over the last 12 years. Considering the dramatic redevelopment of Downtown Silver Spring and the residential construction upcounty in that period of time, that is extremely difficult to believe.

Last December, I showed you our video of conditions at the intersection. Remember the sight of cars stacked up towards Wheaton as far as the eye can see? Remember the constant illegal left turns? Remember how the pedestrians had to maneuver past cars stopped in the crosswalk? Of course you remember and there is no need to show you that chaos again. As I recall, that video provoked quite a reaction in this room. Many things were said at the time, but I do not remember anyone saying, "Hmmm… now that intersection has great traffic flow!"


Perhaps the issue here is how CLVs are used for purposes of analysis. Critical Lane Volume is after all a volume measure. As the number of cars proceeding through an intersection goes up, the CLV goes up. Now imagine a perfectly gridlocked intersection. No cars can move. What would its CLV be? Exactly zero. After all, no cars would be able to get through. Is it possible that the Georgia-Forest Glen intersection's declining CLV indicates more congestion and not less?

Members of the Planning Board, it is highly unlikely that you will find anyone in my neighborhood who believes that the biggest expansion in the history of the state's second-biggest hospital has led to less traffic congestion over the last four years. It is equally unlikely that you will find anyone who believes that afternoon traffic flow on Georgia Avenue has actually improved since the mid-1990's. I hope that you will ask your staff to explain how their data contradicts the facts I have cited today along with plain common sense. I for one would like to hear their answer.

*****

Tomorrow, we will show you a better way to measure traffic.

Monday, May 26, 2008

Defining Deviancy Down at the Intersection of Death, Part One

Imagine if we measured the American economy by estimating Gross Domestic Product once every four years. Forget about measuring other things like employment, unemployment and inflation. And forget about taking monthly or quarterly measurements.

“That’s ridiculous!” you would yell. “How would we understand the different trends in the components of the economy? How would we track the ups and downs? How would we get a complete picture of what’s going on?”

And you’d be right. But guess what: that is how we measure traffic in Montgomery County.

Montgomery County’s Planning Department measures traffic by calculating Critical Lane Volume (CLV) at each of 422 intersections in the county. CLV is the maximum hourly sum of conflicting auto movements, both through traffic and turns, proceeding through an intersection. (You can see how the measurement is constructed on page 6-26 of the 2006 Edition of the Mass Highway Manual.) CLV is dependent on volume. An intersection without cars would have a CLV of zero. As traffic picks up, CLV rises. But in a perfectly gridlocked intersection, no cars would be able to move and CLV would go back down to zero.

The Planning Department measures CLVs at each intersection by sending out traffic surveyors to count cars in both the morning and evening rush. But since Planning has limited resources, the surveyors can only appear at each of the intersections every four years or so. What if the weather is bad? What if there’s an accident nearby? Too bad, the survey results are in. Whatever happened on that one day is assumed to be the case on every day for at least the next four years.

Some of these measurement days are a bit unusual. Of the 422 reported CLVs in the 2008 Highway Mobility Report, 22 were taken in December, 23 were taken in January, 30 were taken in February and 3 were taken in August. Are these representative months of the year for driving conditions? Also, 29 of the CLVs were taken in 2003, 14 were taken in 2002 and 6 were taken in 2001. Can these measurements really be compared to estimates made in 2006 and 2007?

Moreover, the Planning Department assumes that a high CLV means high congestion. In fact, a high CLV means an intersection is carrying a lot of traffic. Remember – it rises with volume. An extremely congested intersection is one where it takes a long time to get through. In that case, the CLV may actually be quite low. How about measuring average delay times or average speeds? The Planning Department reports average speeds in travel runs taken on MD-355, Georgia Avenue, US-29, Norbeck Road, Connecticut Avenue, Clopper Road and Great Seneca Highway in 2005 and 2007, but those runs were one-day spot-checks covering only a fraction of the county’s intersections. Nevertheless, these travel runs provided valuable data and we will cover them in more detail later this week.

So why should you care whether Planning measures traffic badly? For one thing, an intersection’s CLV plays a role in determining whether developers building nearby will have to pay for traffic mitigation measures. If your CLV was measured on a day in which traffic was abnormally low, it might fall below the allowable traffic standard in that policy area. That would make it easier for a developer to escape responsibility for mitigating the effects of any new traffic generated by additional construction.

In Part Two, we’ll look at how the county’s faulty traffic measures have played out at the intersection of Georgia Avenue and Forest Glen Road, also known as the Intersection of Death.

Traffic Week on Maryland Politics Watch

Dear readers, I am going to tell you something you already know: traffic congestion has reached catastrophic levels in Montgomery County. We measure it badly. We do not plan around it very well. But we can do better.

In a special five-part series, MPW offers an unprecedented look at our county's traffic measurement system. Today and tomorrow, we look at how we currently measure traffic and why we come up short. On Wednesday, Thursday and Friday we propose an alternative measurement system and preview its results. Our recommendations are radical. They are sure to be resisted by the county's Planning Department. But radical problems demand radical solutions. Our plight is truly dire. Let the timid flee, let the entrenched bureaucracy fossilize and let the naysayers be bound and gagged! None of them will be spared from Traffic Week on Maryland Politics Watch.

Sunday, May 25, 2008

Montgomery County Planning Department Announces Cuts

For those who doubt that the County Council mandated actual cuts in its recently passed budget, the Montgomery County Planning Department is providing a sobering rebuttal. In a recent press release that we are reproducing below, Planning detailed the activities it will have to scale back to accommodate a 3% cut in its budget.

The Planning Department's work is vital for shaping the future of the county. They have an excellent, professional staff that struggles to keep up with the work load generated by servicing a county of nearly a million residents. If this year's cuts are followed by more in the future, their ability to update master plans, recommend traffic mitigation measures and assess the impacts of new developments will be severely impaired.

May 23, 2008

With Fewer Funds in 09, Montgomery County Planning Department Will Cut Traffic Relief Studies, Environmental Protection Analyses, Other Programs

SILVER SPRING, MD –The fiscal year 2009 budget approved yesterday by the Montgomery County Council includes $18.9 million for the Montgomery Planning Department, approximately a 3 percent cut from the previous year when factoring in mandatory spending increases.

Facing fewer funds, the Planning Board during budget discussions with the County Council identified services and programs that will be cut starting July 1.

On that list is the county’s oldest master plan – Westbard, on the western edge of the growing Bethesda area – that planners had targeted for an update. Master plans help guide development, set zoning, establish transportation improvements, lay out pedestrian routes and establish environmental protection measures. The Westbard community, surrounding River Road and Little Falls Parkway, will have to wait at least a year.

Another plan to be delayed is Battery Lane, a small neighborhood on Bethesda’s northern edge, where density, the expansion of the National Naval Medical Center and affordable housing are particularly important. The Council had asked the department to address those issues in a sector plan.

Last fall, the Council approved the 2007 Growth Policy, a biannual law that helps match transportation, schools and other public services to new development. At that time, the Council mandated aggressive new requirements for developers to mitigate traffic impacts in a number of innovative ways, including mass transit. That requires planners to even more carefully analyze every development plan for congestion relief strategies. With the funding cut, planners will not be able to fully carry out the Council’s intent, which they had hoped to achieve with additional transportation staff. Instead, for example, transportation planners might recommend that a developer fund construction of a new turning lane to alleviate traffic concerns posed by new growth rather than recommending more complex, long-term solutions like mass transit. In addition, planners will not be able to conduct much-needed analyses of countywide parking needs and traffic congestion.

Environmental protection initiatives also will be delayed or abandoned. A state-required plan to analyze the county’s long-term water supply and quality will be delayed by at least a year, while a proposal to study the county’s energy needs to recommend strategies to reduce demand and generate energy will be scrapped.

County residents used to visiting the department’s public information counter to learn about zoning, development plans and community master plans may find the counter closed. Planners expect to limit service hours given dwindling staff.

The fiscal shortfall mostly affects personnel, which makes up 90 percent of the Planning Department’s budget. The funding reduction forces the department to reduce staff. Unable to fund positions, the department will freeze vacancies resulting from retirements and resignations in hopes of shrinking the workforce and avoiding layoffs. In addition, for the first time in many years, the department will not offer paid summer internships to college students.

Friday, May 23, 2008

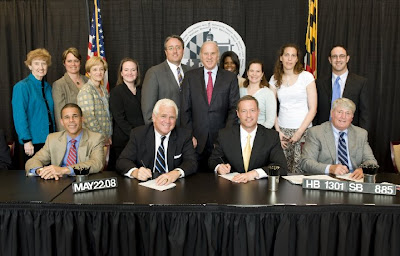
Bills in Honor of Jane Lawton Signed into Law


On Thursday morning, Gov. Martin O'Malley signed two bills passed in memory of Del. Jane Lawton. As Sen. Rich Madaleno explained:
The Jane E. Lawton Loan Program will provide eligible homeowners with access to low interest loans to improve the energy efficiency of their homes through the installation of new windows, insulation, and heating equipment. The Jane Lawton Farm-to-School Program will provide public schools with the ability to buy local produce for school meals.
Both are excellent programs on issues Jane cared about and was working hard on before her death towards the end of last year.

Seated in the photo are Lt. Gov. Anthony Brown, Senate President Mike Miller, Gov. Martin O'Malley, and House Speaker Mike Busch. Standing in the photo are
Sen. Jennie Forehand, Del. Heather Mizeur, Karen McManus, Del. Anne Kaiser, Sen. Rich Madaleno, Steve Lawton, Lisa Jackson, Kathleen Lawton-Trask, Stephanie Lawton, and myself.

Katie Madaleno Hodge Signs Her First Bill

Governor Katie Madaleno Hodge Signs Her First Bill into Law

Sen. Rich Madaleno's daughter got some practice signing bills into law. Katie for Governor in 2034!

Is the Washington Post Credible on Labor Issues?

Last Sunday, a Washington Post editorial slammed Montgomery County’s recently-passed budget as full of “sweetheart deals” for the county’s public employee unions. The week before, the Post ran an article by Ann Marimow titled “Union Influence Sways Budget Talks” during the middle of the County Council’s budget deliberations. And when the Post endorsed labor-backed Nancy Navarro during the District 4 County Council special election, they offered one caveat:

Ms. Navarro makes no bones about her alliance with labor, but we hope she will be sufficiently independent-minded to see that annual pay increases of 8 percent are simply not sustainable in the current budgetary environment.
These may not be disconnected events. In fact, they could be a product of the Washington Post’s long, contentious history with its own employees’ labor unions. Today we expose that history for our readers.

The Post’s labor difficulties date back at least to the early 1970s. At the time, two craft unions – the printers (who set type for the paper) and the pressmen (who ran the printing machines) – dominated the newspaper’s physical production. They occasionally abused their power with job actions, including a wildcat (unsanctioned) strike in 1973. The Post decided to fight back by introducing a new set of labor-saving photographic composition equipment, secretly training non-union workers to operate it in an Oklahoma City “scab school.” In 1975, the Post installed their new equipment in their headquarters, causing the printers and pressmen to walk out. But the pressmen sabotaged the new machines, set fire to one of them and viciously beat a manager on their way out, thus igniting a 139-day strike. Keeping the paper running with non-union labor, the Post eventually settled with the printers and permanently replaced the pressmen, crushing the latter union once and for all. Management’s experience with the violent, Luddite pressmen has shaped its labor philosophy ever since. (You can read accounts of this infamous strike here, here and here.)

Among the concessions secured by the Post from the rest of its now-intimidated unions was a two-tier wage scale. Current employees were given raises but the entry-level scale was not changed. As a result, new employees were often paid less than veterans even though they occupied the same positions and did the same work. Management made things worse by bumping up some new workers to veteran scale while not doing the same for others, a practice perceived by the workforce as reeking of favoritism. And the new, lower-paid workers were more likely to be minorities, adding a racial element to the tension.

In 1987, the Post declared a bargaining impasse with their reporters in the Newspaper Guild after 16 months of negotiation over this issue and others. Guild members retaliated with a “byline strike” during which they refused to allow their bylines to be used in their articles. The Post ignored the tactic and unilaterally imposed its terms on the union. The Newspaper Guild launched two more byline strikes in 2002 and was able to slightly improve the Post’s offer in that bargaining round.

The Post’s latest labor dispute involves its production workers, who are represented by the Communications Workers of America (CWA). When CWA’s contract expired in May 2003, the Post insisted on withdrawing from the union’s defined benefit pension plan. After five years of stalled bargaining and no pay increases, CWA struck back with a publicity campaign. The Post has also not renewed a labor agreement covering 26 electricians that expired last December.

Do the Post’s recurring labor problems affect its coverage? Ann Marimow’s article describing union influence over the county’s budget may have appeared during the critical final week of the County Council’s deliberations, but a few of her sources tell me that it was being prepared for at least two weeks prior. Some political actors in Rockville suspect that the timing of the article’s release (which is not controlled by Ms. Marimow) was deliberately designed to shape the outcome of the County Council’s budget decisions. That suspicion may not be justified but the very fact that it is regarded as credible at all is a big problem for the Post.

The Post’s tempestuous union history calls into question its impartiality on labor reporting, especially with regards to local labor issues. I am not an impartial source on labor myself. As a result, I frequently disclose to MPW readers: “The author is the Assistant to the General President of the United Brotherhood of Carpenters.” Our readers should consider that fact when they read my reporting and opinion. Perhaps the Washington Post should issue a disclosure statement after every one of its articles on labor issues such as, “The Post is a unionized employer and has been party to numerous labor disputes over the years.” MPW readers have a right to disclosure. So too do readers of the Washington Post.

Thursday, May 22, 2008

TO PLAN - or not to plan?

By Sharon Dooley. Ms Dooley is the legislative Director of Upcounty Action and is looking closely at the selection process here.

The new line up of planning board interviewees shows a diversity of ideas, sexes, races and planning orientations. The council has whittled the original list of 29 – down to a round dozen. One (Wendell Holloway) has already withdrawn his name, but the others wait their turn for public and -council - scrutiny. It appears that each applicant has been an active participant in the concerns of this county for many years; in this we are fortunate.

The county, in my opinion, has an opportunity to take a giant step into an innovative future if it takes the bold leap forward that some of these applicants might provide. Few are professional planners, many are citizen activists, and more than a few are lawyers. Five are women, only two are Republicans (the board make up must include one Republican and one non Republican to balance the vacancies for the commissioners by party). I think, although I am not absolutely positive - as I could not find photos of each applicant, that three are African Americans (the soon to be open seat is currently held by an African American – Alistair Bryant). There appear to be neither Hispanic nor, Asian contenders for these positions.

Fewer members of this group are tied tightly to developers, few are known as environmentalists, one has been with the Housing Opportunities Commission (HOC), and a others have worked for local organizations, such as the WSSC, the PG Parks and Planning Board and Montgomery County Planning Board and the Smart Growth concept. Another is known as a developer, but he is linked with the new urbanism concept, which is conserving of urban areas, encouraging of the streetscape model and green spaces.

I think that there are great opportunities to find commissioners that will step up to the plate here and be ready to start without a steep learning curve. That should be one of the criteria, I think. We have for too long only looked at re-cycling residents from one agency to another in this county, and I am reluctant to advocate this narrowing of our scope. In a county of almost one million residents, we should look for diversity of ideas as well as gender and race.

I encourage the council to ask the tough questions about the future as they proceed with these interviews:
· What is their vision for the 21st Century in the county?
· What will they sacrifice to save our forests and agricultural reserve?
· How much density is tolerable; how much gridlock can we bear before insanity sets in?
· When will we create a real plan for affordable housing that offers more than a few hundred options each year? (We are currently more than ten years in arrears from previous schemes.)
· When will we seriously look at transit and create a realistic plan that funds it instead of more roads?
· What are their ideas for keeping clean air, increasing the green buildings in the county and reducing our dependence on traditional fuel sources in buildings here?
· When will the council ask more of the planners? Master plans are a way of life here – how can they be kept from becoming routine rote reviews that are retooled every twenty years or so? Hopefully, this new commission will deep six the mini-masters that were proposed as a way to circumvent the current schedules.
· When will the planning board step up itself to direct staff to create traffic studies and capacity measures that adequately address these issues using national norms and standards?

For quite a while Montgomery county planners have rested on their laurels using the standards that they set in place a generation ago. Quite properly, the county received many honors for these innovative practices; but in my opinion we have stagnated, while other parts of the country have taken our initial ideas and brought them to new levels and tried pilots with citizen input, development, housing and transit that we are not even considering. The cities of Portland and Minneapolis are among the new leaders in urban development. We have an opportunity to send a strong signal by starting down new paths and opening new doors – let’s take them and move toward real innovation and increased integrity in our planning process by selecting new commissioners who have a vision for tomorrow and for the tomorrows future generations can enjoy.

Governor, Leave it Alone (Updated)

One month ago, I criticized Governor O’Malley for allocating $46.3 million for school construction in Montgomery County instead of the $55 million he promised our state delegation in the special session. After that, I was willing to let it lie. I know how tight the state budget is. But the Governor will just not let this go.

According to Maryland Moment’s John Wagner, the Governor went after Montgomery County school construction director Joe Lavorgna at a recent Board of Public Works meeting. The Governor claimed, correctly, that his administration had allocated $98 million for school construction in its first two years – much more than Governor Ehrlich’s $19.6 million. Wagner reports this exchange:

“Was there another county that got as much as $98 million?” O’Malley asked Joe Lavorgna, who oversees school construction in Montgomery County and attended the board’s meeting.

Lavorgna had been invited to the lectern by Franchot, a former Montgomery delegate, to explain the ramifications of receiving less funding than Montgomery officials had anticipated based on closed-door conversations during the special session. During that session, lawmakers took tough votes on tax increases and slot machines.

Lavorgna said that some local money would be used to close the shortfall in construction funding and that some projects could be pushed back.

O’Malley asked Lavorgna to give a copy of a chart showing a comparison to the Ehrlich years to his boss, Montgomery Schools Superintendent Jerry D. Weast. O’Malley said spoke recently with Weast by phone.

Lavorgna appeared taken aback by the exchange.

“I’m not here to complain about the state aid,” he said.
The Governor should have let this drop. Instead, he is putting this issue back in our faces. And he is badly misreading the political mood in this county.

1. Montgomery County residents have just suffered twin hits from state and county tax hikes. No one, not the richest nor the poorest, has escaped them. And on top of that, we are being reminded that our state aid is less than our legislators were promised.

2. The school construction fight exacerbates a long-held perception that the county does not get its fair due from the state. In last week’s apocalyptic budget sessions, County Council President Mike Knapp said from the dais that the state regarded Montgomery County as its “piggy bank.” None of his colleagues disagreed with him. More people are beginning to remark on the statistic that Montgomery gets only 15 cents of every dollar it pays in state taxes back in the form of direct state grants. The state average is 35 cents.

3. School construction is a big issue in this county. Frustration about over-crowded schools was a factor in electing several slow-growth County Council Members in 2006. Last year’s growth policy doubled development impact taxes in an effort to pay for more school capacity. And delays on school improvements have been a hot topic for many county parents over the last several months.

4. Opposition to disparate impacts on Montgomery County drove many of our state legislators to vote against the Governor’s proposed millionaire tax. Now that the Governor is resurrecting the school construction dispute, he is encouraging our delegation to act more parochially. This is unhealthy for his remaining agenda.

Politicians, of all people, are hardly surprised when other politicians break their promises. (It is always entertaining to hear one of them complain about how politicians in general can't be trusted!) The wise thing for the Governor to do would have been to let this lie and move on to other matters likely to attract our state legislators’ support. But instead he is throwing the school issue back at us and inviting discontent. Governor, for your own sake, leave it alone.

Update: The Baltimore Sun has more here. It seems the event was instigated by Comptroller Peter Franchot and that makes the Governor's reaction slightly more understandable. However, the Governor should have known better than to fall into the Comptroller's trap.

Wednesday, May 21, 2008

On Political Pulse

Sam Schwartz, a nationally recognized traffic engineer and planner who has been retained by the Town of Chevy Chase, will be on the 'Political Pulse' TV Show on:

-Thursday, May 22nd at 9:00 p.m.; and

-Tuesday, May 27th at 9:30 p.m.

Mr. Schwartz has analyzed the ridership and other information compiled thus far by the Maryland Transit Administration (MTA) regarding the different alternatives and routes that are being studied for the Purple Line.

Other guests that have appeared in the past on 'Political Pulse' regarding the Purple Line include Mike Madden, the MTA's Project Manager for the Purple Line, Ben Ross from the Action Community for Transit (ACT) and community activist Pat Baptiste.

Political Pulse is on Channel 16 TV in Montgomery County.

What Do Duct Tape & Kraft Mac and Cheese Have In Common?

You can also include the zip code, Barack Obama's parents, the Minimum Wage, the Golden Gate Bridge and the Lincoln Tunnel. If you don't know and are dying to find out their connection then just click here.

This has nothing to do with our normal focus of MoCo Politics. But it is still fun to think about.

Income Inequality in Montgomery County

In Part One of our two-part series on income inequality, we reported that growing labor market inequality was fueling rising income disparities in Maryland. Today, we look at what is happening in Montgomery County.

The Bureau of Labor Statistics’ Occupational Employment Survey produces data at the metropolitan area level, including a series combining Montgomery and Frederick Counties. But small sample sizes at this geographic level handicap some of the individual occupational observations with unacceptably large standard errors. So we turned to a rich source of locality data that is less burdened with sample size issues: the decennial census.

The Census Bureau reports detailed demographic, economic and real estate data down to the census tract level (and even further) every ten years. We identified the five wealthiest neighborhoods and the five poorest neighborhoods, defined as census tracts and using per capita income, in Montgomery County in 2000. We then compared real per capita income, measured in 2007 dollars, in each of these census tracts between 1989 and 1999. We also looked up black and Hispanic population percentages for each census tract. In Potomac, we had to merge two census tracts to obtain comparable data for 1989 and 1999 because of changes in the area’s census tract definitions in the 1990s. We report our results below.


Measured by per capita income, the five wealthiest neighborhoods in Montgomery County are Chevy Chase Village, Potomac, the section of Bethesda west of its Central Business District, the Bethesda neighborhoods on either side of Democracy Boulevard and the Martin’s Addition and Rollingwood sections of Chevy Chase. The five poorest neighborhoods are Langley Park (separated into two census tracts), the section of Rockville east of the CSX tracks, the section of Wheaton west of Veirs Mill Road reaching up to Rockville, and the Oakview neighborhood in Silver Spring (southwest of the intersection of the Beltway and New Hampshire Avenue). On average, the percentage of black and Hispanic people living in the poorest neighborhoods is ten times their percentage in the richest neighborhoods.

Between 1989 and 1999, four of the five richest neighborhoods saw double-digit gains in real per capita income. Over the same period, every one of the poorest neighborhoods saw real losses. Together, the richest neighborhoods enjoyed a 15% real per capita income gain while the poorest neighborhoods suffered a 12% drop. The county as a whole saw a 4% real per capita income increase over this decade.

The 1990s was a relatively decent decade for America’s middle and working classes. Real wages ceased their two-decade drop and rose a little bit in many occupations. If Montgomery County’s poorest neighborhoods saw a double-digit real income drop in the 1990s, what is happening to them now?

Rising income inequality is a national, indeed a global, trend. Can Maryland’s state or county policymakers truly reverse it? Measures that might help thwart inequality include:

1. Encouraging unionization.
2. Funding public employee contracts, especially for the lowest-paid workers.
3. Investing in public education, the state university system, vocational training, apprenticeship programs and ESOL instruction.
4. Supporting minimum wage, living wage and prevailing wage laws as well as other worker protections (like Montgomery County’s domestic worker bill).
5. Cracking down on unscrupulous employers who cheat workers.

Will all of the above, if implemented with gusto, really make a difference? Possibly. But one thing is certain:

Every state legislator who voted to pass the regressive special session tax package and then opposed the millionaire tax effectively voted to make Maryland’s – and Montgomery County’s – income inequality worse.

Tuesday, May 20, 2008

Income Inequality in Maryland

Last month, the Center on Budget and Policy Priorities (CBPP) and the Economic Policy Institute (EPI) released a study on income inequality in all 50 states. We reproduce their results for Maryland below and add some new research of our own in Part One of a two-part series.


The above analysis shows that income inequality has been growing steadily in Maryland since at least the 1980s, as it has been in the rest of the country. Why is that? There are many potential explanations, but as a union researcher, my natural inclination is to look at the labor market. What is happening to pay for Marylanders?

The Bureau of Labor Statistics’ Occupational Employment Survey program releases occupational employment and wage data from surveys of employers at the national, state and metropolitan area levels. The program has produced methodologically consistent longitudinal data going back to 1999. While some of the data is handicapped by small sample sizes and resulting large standard errors, many occupations report wage levels within 95% confidence intervals even at the state level.

We picked a list of 15 of the highest-paying occupations and 15 of the lowest-paying occupations in Maryland. The high-paying occupations all paid at least $35 per hour in 2007 dollars and the low-paying occupations paid $14 per hour or less. All of these occupations reported standard errors associated with their wage estimates of 6% or less. Together, these occupations accounted for 28% of all employment in the state in 2006 and they accounted for most of the employment at the upper and lower ends of the wage distribution.

For each occupation, we report employment and mean hourly earnings in 1999 and 2006, deflated with the CPI-W into 2007 dollars. We then compute weighted averages (by employment) for each occupational group and compare it to the state average. Below are our results.


As you can see, the 15 high-paying occupations saw a weighted average hourly earnings gain of 19.2% in real dollars. The 15 low-paying occupations saw a gain of just 0.4%, a statistically insignificant difference from zero. Six of these occupations saw real earnings losses. On average, Maryland workers saw a gain of 7.2% in real dollars, or about 1% per year over the period.

But the employment data is also instructive. The fifteen high-paying occupations saw a combined employment drop of 11%. The fifteen low-paying occupations saw employment grow by 18%. This change in employment patterns may be just as meaningful in driving labor market inequality as the change in the wage structure.

The above data applies to only 30 occupations over just one seven-year period. It cannot be considered as comprehensive as EPI’s work or a true peer-reviewed academic study. But the behavior of the upper and lower ends of Maryland’s occupational earnings distribution strongly suggests one source of the state’s growing income inequality.

Maryland’s labor market is rewarding a smaller and smaller number of people at the top with above-average real earnings gains. At the same time, it is punishing a larger and larger number of people at the bottom with no real earnings gains at all. And there is no reason to believe that this trend will end anytime soon.

In Part Two, we will use a very different methodology to examine income inequality in Montgomery County.

Monday, May 19, 2008

Local First Wheaton!

At yesterday’s rainy Taste of Wheaton event, the county’s newest and most unique business alliance was unveiled.


The seeds of this alliance were planted in last summer’s joint business/resident revolt against the county’s disastrous plan to extend parking meter hours. No one remembered the last time Wheaton’s businesses and its customers joined together to successfully change county policy. Everyone knew that if we did not build on that effort, the community spirit created by the revolt would fade.

So the rebel leaders met at Caramelo Bakery to plot what to do next. It was an unusual gathering. Attendees included a Cuban non-profit director, a Scottish pub owner, a Venezuelan baker, an Asian tea shop owner, a Salvadoran restaurant owner, an African-American County Council Member, a federal government economist and a trouble-making union hell-raiser from New Yawk. We decided to build a new business association, but not merely an extension of the Wheaton-Kensington Chamber of Commerce. The new group would focus on the small businesses that make Wheaton special, as well as their customers.


From left: Caramelo Bakery owner Freddy Real, Denise Isaac of Telemundo, Hall-of-Fame activist and business owner Marian Fryer and LEDC’s Daniel Parra announce the formation of the new association.

The alliance, eventually known as Local First Wheaton, would be open to small, local and independent businesses. The firms would cross-market each other’s products, do business among themselves, attempt to pool resources to get better deals on clean electric power and, most importantly, appeal to the residents of nearby neighborhoods to shop locally. When customers direct their shopping habits to nearby small businesses, they build job creation and investment in their local economy and minimize carbon emissions by driving less. Civic associations and even individuals would also be welcomed as associate members. Our model borrowed liberally from the Business Alliance for Local Living Economies (BALLE), a national organization which had created similar local business alliances in Denver, Chicago, Seattle, Cambridge, Buffalo and other cities. The Latino Economic Development Corporation (LEDC), a non-profit providing aid to small businesses, had already started a Local First group in Washington, DC. Now that LEDC had established a Wheaton office in the Gilchrist Center, its leaders, along with the businesses and residents who triumphed in the parking meter revolt, judged that now was the time to create Local First Wheaton.


From left: LEDC Executive Director Manny Hidalgo, District 18 State Delegate Ana Sol Gutierrez and LEDC Maryland Business Director Daniel Parra.

Local First Wheaton has just launched its website and has signed up its first batch of members. Its logo and its membership directory will soon begin appearing all over Wheaton’s Central Business District. Soon after, we will market the alliance to the residents of nearby civic associations. Gasoline prices of $4 or more per gallon may be challenging to our members’ finances but they will provide an incentive for nearby customers to stay close to home. And once Local First Wheaton is established, we will export the model to other business districts in the Downcounty.

So come to Wheaton and check us out! Our members will make sure you’ll be back.

Sunday, May 18, 2008

Just How Dominant are the Democrats in Montgomery County?

From Marc Korman:

We all know that Democrats are dominant in Montgomery County. But have you ever thought about what that really means?

Don Praisner’s election earlier this week to the County Council ensures that the Council will remain 100% Democratic, with 9 out of 9 members as Democrats.

Since Jean Cryor’s defeat in 2006, 24 out of 24 State Delegates from Montgomery County have been Democrats.

Since 2002, 8 out of 8 State Senators from Montgomery County have been Democrats.

As of April 2008, there are 288,414 registered Democrats in Montgomery County, compared to 121,265 Republicans. Unaffiliated voters are close behind with 102,864. Back in April of 2004, there were only 257,825 registered Democrats, compared to 126,894 registered Republicans and 92,659 unaffiliated voters. That means Republican numbers have declined over the past four years while total registration has increased by over 35,000.

There are 19 municipalities in Montgomery County. Although their elections tend to be non-partisan, at least 15 are headed by registered Democrats. The Chairman of Chevy Chase View is unaffiliated, the Chairman of the Village of Chevy Chase Section 5 and the Laytonsville Mayor are Republicans, and no information was available about the head of the Martin’s Additions Village Council.

So is this type of political dominance healthy? It depends. As long as Democrats are not walking in lock step with one another and continuing to have healthy debates and providing good government, then there really is not much of a problem.

Take the County Council’s budget debates for example, heavily covered by Adam and David here at MPW. The members of the Council have different positions on what the next budget should look like, but they are all rooted in the idea that government should provide good services to the people, helping to lift everyone’s quality of life. This is a Democratic idea that the various Councilmembers have different paths to achieve.

As a member of the Montgomery County Democratic Central Committee, I must admit I am biased in favor of the Democrats. But as long as our elected officials remain responsive to their constituents and responsible in their leadership, I think residents will continue to reward the Democratic Party.

Friday, May 16, 2008

It’s Over – For Now


After a torturous few months, the Montgomery County Council finally reached a unanimous budget agreement today. But while the bleary-eyed Council Members are no doubt working their way through their liquor cabinets as we write this, the fiscal hangover will arrive all too soon.

Yesterday’s cliffhanger boiled down to this: three Council Members (Duchy Trachtenberg, Phil Andrews and Roger Berliner) wanted $20 million in “labor savings” gained by a 2-day furlough, while two Council Members (Valerie Ervin and George Leventhal) said they would not violate the public employees’ contracts. Marc Elrich expressed dissatisfaction with the structure of the property tax while Nancy Floreen argued for more cuts not connected to the labor agreements. The final solution announced this morning by Council President Mike Knapp contained elements of every one of these ideas. We present the text of his proposal to our readers:

Statement by Council President Mike Knapp

To enable the Council to reach common ground and complete action on the FY09 operating budget, I propose the following final steps in the budget process:

1. Reduce the amount of property tax proposed by the County Executive by $20 million.

2. Keep property tax rates at the current level and provide a credit to owner-occupied homes of $579.

3. Reduce expenditures and change resources as follows:

$8.0 million from County Government and MCPS, to be achieved by reducing employee/personnel costs and securing productivity improvements and increased efficiencies. Each will report back to the Council about how these reductions will be achieved.

$1 million in fund balance from Montgomery College.

$3.5 million from the Council’s changes on May 15 to PAYGO (cash) in the FY09 capital budget and resources for Park and Planning.
After a long night of yelling, negotiating, coffee-swilling and perhaps coffee-throwing, none of the Council Members had any fight left in them to repeat the political theater of prior days. All praised the placid Mike Knapp and none claimed victory over the others for their priorities. Apparently they have tired of providing fodder for loose-tongued bloggers and I do not blame them.

But everyone on all sides of the debate – the Council Members, their staff, the Executive Branch, the union leaders and all other observers – expect that the approval of this budget is only the first round in a bruising match. That is because FY10’s budget will most likely also have a deficit in the hundreds of millions and similar debates will no doubt erupt. Drink up, Council Members, because here is what the morning after will look like:

1. The public employee unions preserved their contracts this time. But two Council Members (Phil Andrews and Duchy Trachtenberg) openly favored two-point reductions in their cost of living adjustments (COLAs). One more, Roger Berliner, favored a two-day furlough proposed by Mr. Andrews. Another one, incoming Council Member Donald Praisner, suggested a need to “review” union contracts during his special election campaign. That leaves the County Council only one vote away from approving “labor savings” next year. The unions are well aware of this situation and must work out a strategy to respond. They would be well-served to stick together.

2. All sides must watch the real estate market, which drives the county’s volatile recordation and transfer taxes. In an earlier post, I stated:

According to the county’s Department of Finance, residential real estate sales volume averaged over $500 million per month from 2006 through the first eight months of 2007. Since then, residential real estate sales volume has averaged between $200 and $300 million per month. It is this collapse in residential real estate transactions that has caused many of the county’s current budget problems. All policymakers – both inside the government and inside the unions – should watch this figure in the Finance Department’s monthly economic updates. If it rises back up to $400 million per month or more, the county’s real property transfer and recordation taxes will begin to recover. If it falls further, tougher times are ahead.
If the real estate market does not turn up by the end of this year, projected revenue growth for FY10 may be even slower than the anemic rates that constrained the FY09 budget.

3. The county is getting hit badly by rising fuel costs. The agencies’ budget requests did not adequately predict the meteoric recent rise in gas and diesel prices. If the County Executive submits a supplemental budget request to cover higher fuel costs, will the County Council be able to locate the money without offsetting spending cuts?

4. As we documented a month ago, the state budget continues to deteriorate. Rumors are flying that the state will have to cut aid to the counties next spring, perhaps even passing down the burden of paying teacher pension contributions. This would add MANY millions more to any county budget deficit next year.

The County Council, and especially its ever-smiling (but seldom-blogging) President Mike Knapp, performed very well this year under heavy pressure. They will need to rise to the occasion at least one more time before the current economic downtown is over.

Unions, Contracts, and the Political Calculus of the Budget Debate

A guest post from Eric Luedtke, who is a teacher and a member of the board of the Montgomery County Education Association, as well as a past board member of the Montgomery County Sierra Club. He writes here as an individual, not representing the views of any organization.

For the people involved directly in the current discussion about the county budget, the debate is an emotional one. County employees don't see the contracts as a budget item, or the proposed cuts to those contracts as an 'employee contribution', as they were euphemistically referred to in the budget documents the County Council looked at today. To us, it's about the money we need to survive in a county where the cost of living significantly outpaces what county employees make. It's gas money, or rent and mortgage money, or, in my case, the money I need to cover day care costs for my son. For those who style themselves as taxpayer advocates, it's about limiting tax increases. Then there are those few who see this as a way to stick it to the unions, based on whatever personal vendettas they may have.

But there is another angle to this debate as well, one that has serious repercussions for the 2010 elections. And it can all be summed up in a question a friend of mine asked me a couple weeks ago, "When did being slow growth make you anti-union?"

There are three significant bases of power in county-level elections in Montgomery County. Two of them are at opposite ends of a spectrum, the slow-growth and no-growth advocates who are interested in making sure our county's growth is sustainable, both environmentally and in terms of the services we receive, and the pro-development crowd who see growth as an opportunity to build Montgomery County's economic base or, in some cases, an opportunity to line their own pockets. There is little if any middle ground between these two groups. Which is one reason why the third power base, the public employee unions, often have significant influence on who gets elected in the county.

When George Leventhal beat Blair Ewing in 2002 by a little more than a thousand votes, he did it with support from the developers' Go Montgomery slate. When Duchy Trachtenberg and Marc Elrich beat out Mike Subin in 2006 by less than 10,000 votes, they had both the slow growth community and the unions on their side. For comparison, note that the MCEA, the union to which I belong, has around 12,000 members. That's more than the margin of victory in both those races. And MCEA is only one of the public employee unions in the county.

So for either side in the growth debate, having the support of public employees can provide the boost needed to win election. And alienating those public employees can seriously undermine their electoral potential. As a number of prominent members of the slow growth community have recently been calling for cuts to employee salaries, salaries which are sustainable in the current budget situation, a sense has developed among many public employees that the slow-growth community is anti-union. I personally don't believe this is true, as I know a number of leaders of the slow-growth movement who are passionately pro-union. But the debate in the recent Council District 4 election, statements circulating by e-mail from Civic Federation activists, and comments made by a number of slow-growth members of the council make that argument a difficult one to maintain.

Adam's right - unions don't forget. And they have especially long memories when it comes to broken contracts. At the MCEA Representative Assembly, people still angrily bring up the broken contracts of the early 1990's, mentioning that public employees have never made up for those losses in salary, and never will. Those who vote to violate negotiated contracts, to damage the county's public services by undemining its workforce, will have little to no chance of support from these unions in the next election cycle. So it's entirely possible that this will be the political landscape of the 2010 elections:

In District 4, with Don Praisner sticking to his promise not to run for re-election, School Board President Nancy Navarro would be the heavy favorite to win. In District 3, if a credible challenger to Phil Andrews materializes, there will be massive support for someone perceived as an enemy by both developers and by unions. In the at-large races, incumbents who vote to break contracts will, as was the case with Mike Subin in 2006, see serious challenges from people with union support. Meanwhile, Valerie Ervin, George Leventhal, and Mike Knapp, all of whom are friendly to the unions, will almost certainly have massive union support. So the razor-thin slow growth majority on the council could shift easily.

I would argue that it's a bad idea on the merits to cut the salaries of those employees who teach this county's children, protect its citizens from crime and fire, maintain its roads, and staff its libraries. But leaving aside the merits of the arguments, the slow growth coalition in the county is courting disaster right now. And given that, 2010 looks to be a very different election year than 2006 was.

Thursday, May 15, 2008

Deadlock


The County Council gathered today to pass its budget for next year. Because that budget calls for a property tax hike in excess of the rate of inflation, the county’s charter requires seven votes for it to pass. Instead, the County Council split on a 4-4 vote. Deadlock.

First the preliminaries. The council voted unanimously to divert $25 million from the PAYGO program to the operating budget. As we reported yesterday, PAYGO is a cash contribution made by the county to its capital program, which is otherwise financed by bonds. Council Member Marc Elrich recommended this measure yesterday and the rest of the council agreed. The council also voted to cut its “reconciliation list,” or the new spending it intends to add to the County Executive’s proposal, from $40 million to $25 million. The two measures combined freed up $40 million for the budget, equal to the amount of “labor savings” proposed by Council Members Duchy Trachtenberg and Phil Andrews last week.

And then came the vote on Council President Mike Knapp’s proposed budget. That budget included a property tax hike of $138 million – equal to the amount proposed by the County Executive, but structured differently. The budget also did not alter the county’s labor contracts. Council Members Knapp, Valerie Ervin, George Leventhal and Nancy Floreen voted in favor. Council Members Elrich, Trachtenberg, Andrews and Roger Berliner voted against. Deadlock.

During the campaign season, many of these council members – all Democrats – tend to sound alike. All favor labor rights, helping poor people, fiscal responsibility, “smart” growth policy and high-quality services. The way to truly evaluate the differences between these council members is how they deal with the gritty specifics of governing. Ms. Floreen loves to say, “The devil is in the details.” (Spend a half-hour with her and she will say it twice.) She is absolutely correct and, in this budget season, there is plenty of hell to go around.


Valerie Ervin and George Leventhal stand on a principle: labor agreements must be honored. Ms. Ervin credits her former membership in the United Food and Commercial Workers Union (parent union of MCGEO) with helping her survive her days as a low-income single mother. Mr. Leventhal believes that high-quality services, especially the schools and public safety, are the reason why people move into Montgomery County. While many residents may be angry about taxation, he asserts that they are not angry at the public employees who serve and protect them. For both Ms. Ervin and Mr. Leventhal, any violation of the public employees’ agreements will erode the county’s ability to provide effective services and damage its value to residents over the long run.


Duchy Trachtenberg, Phil Andrews and Roger Berliner also stand on a principle: taxpayers and employees must both share the pain of reaching a budget in tough times. Ms. Trachtenberg believes that there are people in the county who are more vulnerable than public employees, including the poor, the homeless, seniors and the mentally ill. Mr. Andrews believes that it is only fair to ask county workers to accept pay reductions if residents are paying higher taxes. Whereas before he favored a two percent cost of living [COLA] reduction and “labor savings” in the amount of $40 million, he proposed today that public employees be furloughed without pay for two days. He expects that measure to save $20.5 million, which he would use to reduce the property tax hike. Mr. Berliner agreed with Mr. Andrews and declared that his furlough proposal did not “break the contracts.”

Marc Elrich did not vote against the budget because of the labor agreements, but because he disagrees with the structure of the property tax. As originally proposed by County Executive Ike Leggett, the property tax hike would have contained a significant rate increase but also a large increase in the tax credit. This would have been a rather progressive tax. The County Council voted 7-1 to decrease both the rate and the credit, effectively shifting the burden away from business and apartment buildings and onto homeowners. The council’s rationale was to lower the tax burden on renters by limiting its impact on rental buildings. Mr. Elrich would like a return to something resembling the County Executive’s proposal and is trying to leverage his vote accordingly. Since the property tax formula can be changed in multiple ways, perhaps Mr. Elrich can gain some movement in his desired direction.

Nancy Floreen said, “I don’t see the crisis particularly because we just added $20 million to the budget. I am bewildered by what the ‘crisis’ is.” Ms. Floreen has a point: the council added $40 million to the County Executive’s original spending proposal before cutting it back to $25 million today. These are hardly the acts of desperate times. She further advised against a “last minute reduction taken out of the backs of the people who provide the services.”

The council is now debating the disposition of $20 million out of a $4.3 billion budget. In almost any business or labor-management context, this relatively small sum could be worked out. But the issue has been hardened by the fact that both sides have adopted a position based on principle. Mr. Leventhal and Ms. Ervin will not bend on the labor agreements; Ms. Trachtenberg, Mr. Andrews and Mr. Berliner insist that tax increases must be accompanied by “labor savings.” Either side can block the budget because it requires seven of the sitting eight votes to pass.


And what of Council President Mike Knapp? Pity upcounty’s gentle giant. He is the man in the middle. The District of Columbia elects its Council President for a full term. The holder of that office possesses many carrots and sticks to cajole colleagues into line. But under Montgomery County's rotating Presidency, Mr. Knapp holds his office for only one year. He has much responsibility and little commensurate authority. He faces a badly divided County Council and is struggling to get them past their differences. But he must get them to agree. Because for a county government that is required by law to balance its budget, deadlock is not an option.